Geographic Information Systems have been around for a while. When it comes to location data, we mostly think Google Earth or Apple Maps. However, today, more important than ever, it’s easy to overlook that they no longer define what location based data analytics solutions can do for you.
With it, BI really does quite a lot. Improving productivity, optimizing operation costs, tracking the team actions, equipment, assets and other things. All by the means of highly informative data that becomes crucially vital for decision-making.
As of now, GIS products are finally at a point where they can easily be integrated into any business workflow. One of the few representing this new generation of location analytics software is Aspectum. It allows to get the most out of by offering a truly robust toolset, with API that is flexibly integrated into your BI workflow.
Further, we will expand on what Aspectum can do for your business as shown on a pharmacy chain in Vinnitsa, Ukraine. It was using the platform to pick the best possible location for a new branch while avoiding all the spots with potentially low ROI.
How It All Works
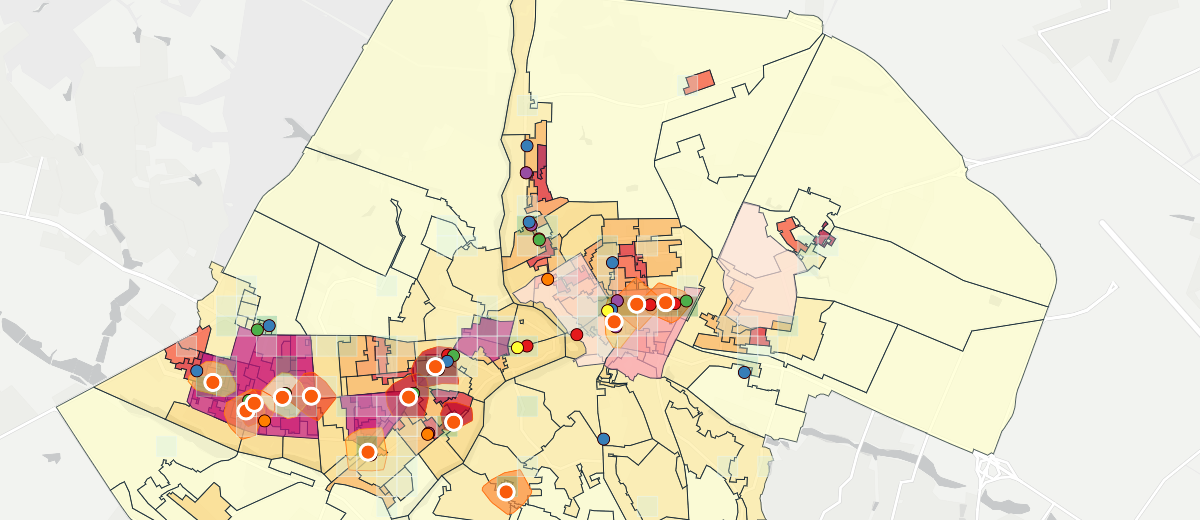
This map is a great display of how retail location analytics can establish awareness over an exceedingly multifaceted environment.
On the screenshot above, you may view pharmacy locations layered over the population density map. The latter shows differences between the highlighted regions, ranging from pale yellow to orange as per intensity of the value. The more intense, the higher the expected demand for new pharmacies. This example does not segment the dataset by age groups, which is often done for similar cases in HoReCa.
This is only the beginning, and so further we are adding the data to forecast the future potential of our new branch.

Moving on to the second image, we have enabled a layer that shows competitors. You can see that each drug store network has a corresponding marker color that allows you to distinguish them. On the bottom left side you can disable each one manually, should you need to.
Additionally, the green square layer shows the density of competitor distribution in terms of the occupied territory.

Next, you can see we’ve added the attractors. Specifically: supermarkets, hospitals and post offices. These businesses are highly important because some of the people visiting them will drop by the pharmacies on their way.
The layer with a green icon is a curious one because it shows how close your competitors are located to these attractors.

Aspectum is great to segment the data. Let’s turn off the competitor and attractor layers as not to get cluttered with the next thing we’d like to see. Turn on the 5-minute walking distance, buildings and commercial real estate renting prices. At the bottom of the screen, we can filter the population density layer and see the very specific population range that we’ve selected.
This way, you can compare the price versus viability and make optimal decisions when opening new branches.
Mapping Long Overdue
With today’s level of adoption, location based analytics haven’t made it into the priority list of most SMEs. Wrongfully so, because it’s much better to showcase large volumes of data via an interactive map.
This guide shows you how much you can convey with a really agile toolset. The template was made in Aspectum, displaying the full capability of GIS software, and you can use it to make informed decisions on expanding your business with your own attractors and also the data on infrastructure. Where its a drug stores or retail store map the product is fully adjustable.