Zone Improvement Codes – or ZIP codes, as they’re commonly known – have different reputations among different people. Some are very familiar with them and may even know them by heart due to their use of postal mail. Others, however, google them frantically when submitting or completing a delivery form. There’s even an argument to make that thanks to the advancement of technology, people shouldn’t even need to remember these codes.
However, data specialists know perfectly well ZIP codes are here to stay. They are still used by professionals across industries to map data. But how efficient is this method of data visualization and when should it be used?
ZIP codes for data analysis
ZIP codes came into being when postal correspondence grew in popularity, and there appeared a need for a more specific code to organize delivery more efficiently.
Their digits represent some crucial information that helps a parcel find its recipient:
- The 1st explains which part of the country is being referred to,
- The 2nd and 3rd explain sectional center facilities,
- And the 4th and 5th represent postal offices and areas of delivery.
However, it is important to note that ZIP codes do not reflect regions and territories. These codes represent groups of destinations and delivery directions, since they were created solely to simplify postal delivery. But how can addresses and routes be used in data analytics? This is when Geocoding software comes in handy. This piece of software can help organizations transform their geospatial data, including ZIP codes, into geocodes. Basically, geocoding means assigning geospatial coordinates to a destination.
Types of ZIP codes
There are different kinds of ZIP codes that apply to mapping – with boundaries, or with point codes.
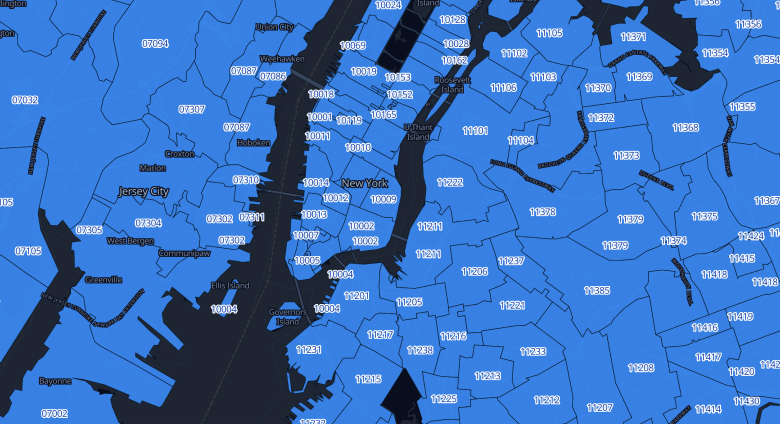
ZIP codes with boundaries
These are standard ZIP codes that mark the boundaries of each code. Even though a ZIP code map doesn’t have clear borders – they aren’t are not polygons, after all – many analysts utilize their limits as a foundation for various purposes. Thus, this approach is used for marking different sales territories. Specialists across industries devise maps for marketing, identify areas of interest, and so on, using these boundaries. Even though many industry specialists refrain from calling these areas “territories” because of the borderless nature of ZIP codes, at the end of the day these maps do reveal areas.
In most mapping software, defining such territories is pretty straightforward. All it takes is importing the data to mark an area of interest (AOI). Once the map is composed, specialists can view the data in AOIs, group it, and share it with other professionals inside and outside their teams, granting them different levels of access.
Point ZIP Codes
These include codes for PO Box Only, militaries, and unique codes.
- PO Box Only denotes that the mail is not supposed to be delivered to the mailbox, but to a post office box.
- Military codes ensure that the military correspondence is delivered to the right military facilities.
- Unique ZIP codes are available for those organizations that receive an overwhelming number of letters and packages.
This type of ZIP code is represented differently on maps as they’re just isolated dots that cannot be represented as coverages, since they don’t have established borders. They usually refer to big organizations such as corporations, educational establishments, residential homes, medical institutions, etc. It is these organizations that take over the final stages of delivering correspondence.
ZIP Code Mapping software
When you decide to map ZIP codes onto GIS coordinates, you’ll need the relevant software. That will allow you to display the available data on a map in a few different ways:
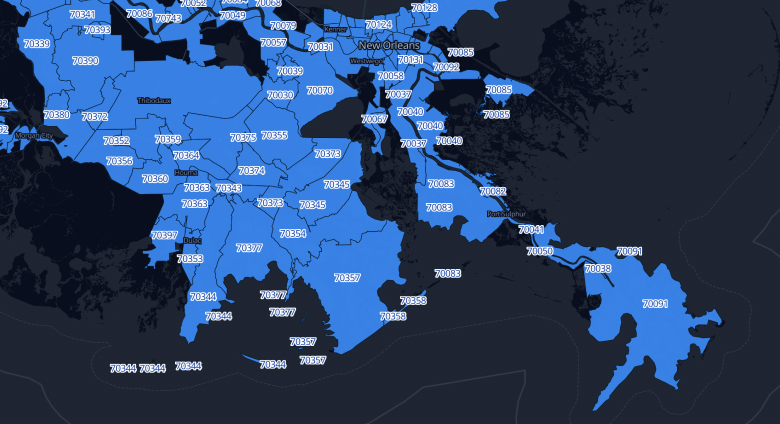
Color-coded ZIP Code maps
They reveal data ranges using different colors. Thus, in such a map, a color corresponds to a value. In the case of a ZIP code range map, it will assign a certain color to a ZIP code, making it convenient for displaying ZIP code areas and their boundaries.
ZIP Code territory maps
These enable data specialists to display areas with greater detail. Even if teams already have a territory map, it can be redesigned, updated, and modified using fresh data. They can also help check if the territories are distributed evenly and in a balanced way.
Zip code heat maps
These are regional maps that use different shades of one color to display the average values of areas within a region. As a result, it can help visualize sales depending on the ZIP code. They are used for tracking market performance by visualizing the best and worst performing zones. Also, they unveil seasonal trends and can help determine which new areas should be focused on next.
What else can ZIP code mapping give you?
ZIP code mapping can display all the sites and facilities relevant to your business. For this, you’ll need to utilize geographical information systems (GIS) tools. Also, ZIP code mapping can improve security at home by monitoring burglaries in a given ZIP code. By collecting and processing location data, including ZIP code analysis, experts can scrutinize break-in incidents to create wide-ranging reports. On top of that, the report’s findings can be grouped by various criteria, for example, by time.
The shortcomings of using ZIP Codes for Geospatial Analysis
While ZIP codes have proven to be effective for processing and delivering mail, they are much less effective for monitoring and analyzing population, as well as patterns and trends of human activities. Some reasons why include:
- ZIP code areas are typically massive, which means they are often too large and inconsistent to be precise.
- ZIP codes lack such important features as legal and/or administrative meaning. Their only function is to direct correspondence to the addressee.
- ZIP codes do not have any social meaning either, as people typically do not associate codes with neighborhoods.
- Spatial Data incorporating ZIP codes can have several scales, which leads to overlapping boundaries or one area being situated within another boundary.
- ZIP codes are sometimes displayed incorrectly in spreadsheets and databases, unless the corresponding column is defined as text or string.
If ZIP codes have so many shortcomings, where does that leave data specialists who want to employ them? Let’s take a look at some possible options to consider instead.
Use other area units
If you are processing data in the United States, you can effectively use other regional identifiers, ones with clear boundaries. For example, you can use counties, Public Use Microdata Areas (PUMA), metropolitan statistical areas, and others. If you are interested in smaller areas, then you can process data from municipalities and census tracts.
Geocode addresses
When an address list is geocoded, data experts can leverage the GIS coordinates assigned by matching them to some specific geographies. Also, in the case of sensitive data, experts can use just addresses and ordinal numbers, which will help map the analysis to contact lists.
ZCTA Data
In case you are left with no other option but to use ZIP codes, you can adjust the ZIP Code Tabulation Areas (ZCTAs). This will help you to assemble smaller ZIP code areas into a larger one, allowing both data visualization as well as statistical analysis.
Takeaways
Not only do data specialists use ZIP codes in mapping – marketing and sales teams do as well. They use ZIP codes with boundaries as well as point codes to uncover relevant insights, often creating color-coded territory and heat maps using geocoding software. However, ZIP codes do have some downsides, leading to alternatives for territorial delineation – like counties, PUMA, and metropolitan statistical areas, as well as geocoding addresses. And if ZIP codes are a requirement, you might want to modify ZCTAs.