This website uses cookies and also collects some information using analytics software to improve user experience.
By continuing to browse this website you accept the use of cookies. See Privacy Policy to know more about how we use cookies.
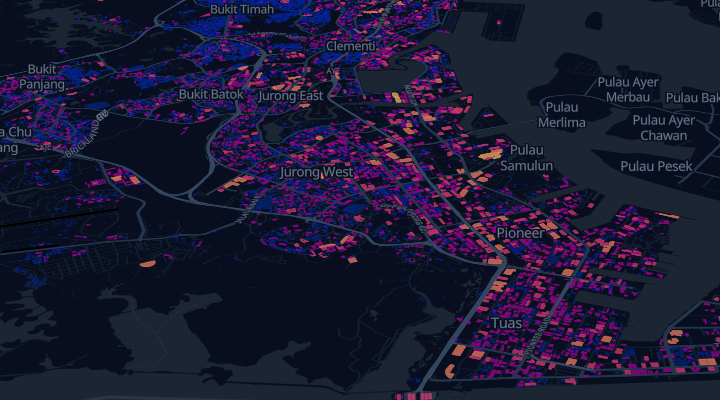
Theoretical solar resource potential
Visualization of Singapore buildings with a calculated index of perspectives to install solar panels on roofs.