This website uses cookies and also collects some information using analytics software to improve user experience.
By continuing to browse this website you accept the use of cookies. See Privacy Policy to know more about how we use cookies.
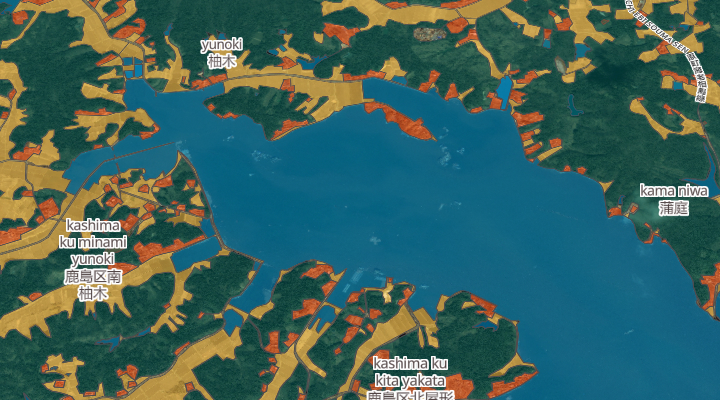
Japan change detection
The map shows the change in urban areas, fields, water bodies before, during, and after the flooding in Japan as a result of the tsunami in 2011.