Business Solutions
All Industries
Public SafetyPublic Safety and COVID-19 HealthcareHealthcare RetailRetail EnvironmentSmart City Financial ServicesFinancial Services
Transport & LogisticsTransport & Logistics GovernmentGovernment Real EstateReal Estate EnvironmentEnvironment
Product Overview
Features Map Gallery Aspectum for Business Platform Security Aspectum vs Competitors User Guide API
Services
Data on Demand Custom Development Expert Sessions Technical Support
Pricing Blog About Us
Sign in My Account Sign up
User avatar
Personal settings Guide Sign out
Business Solution
Industries
Public SafetyPublic Safety and COVID-19 RetailHealthcare RetailRetail EnvironmentSmart City Financial ServicesFinancial Services Transport & LogisticsTransport & Logistics GovernmentGovernment Real EstateReal Estate EnvironmentEnvironment
Product Overview
Features Map Gallery Aspectum for Business Platform Security Aspectum vs Competitors User Guide API
Services
Data on Demand Custom Development Expert Sessions Technical Support
Pricing
Blog
About Us
Log out
Sign in Sign up

Map gallery

Mapping of chemical spills plays a huge role in environmental research and control. Smart maps allow visualizing the disaster itself and its consequences, as well as showing long-term effects. GIS chemical data is vital for sustainable business in regions where heavy industries prevail,

All AgroChemicalsConstructionEducationEnergyEngineeringEnvironmentFinancial ServiceForestryGovernmentalHealthcareHospitalityHumanitarianInfrastructureInsuranceManufacturingMaritimeMediaNGOOil & GasRaw MaterialsReal EstateRecreationRetailSecuritySmart CityTelecommunicationsTourismTransportation & LogisticsUrban Mobility
Industrial water pollution in US

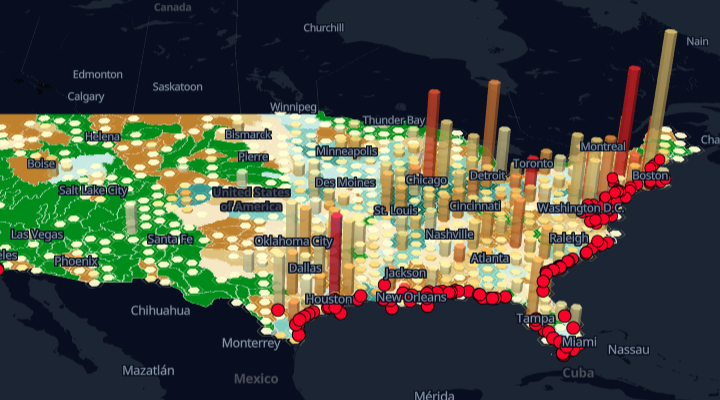
Industrial water pollution in US

The map shows classify areas according to the number of industrial facilities and how much wastewater they generate
Victoria’s Human Mobility

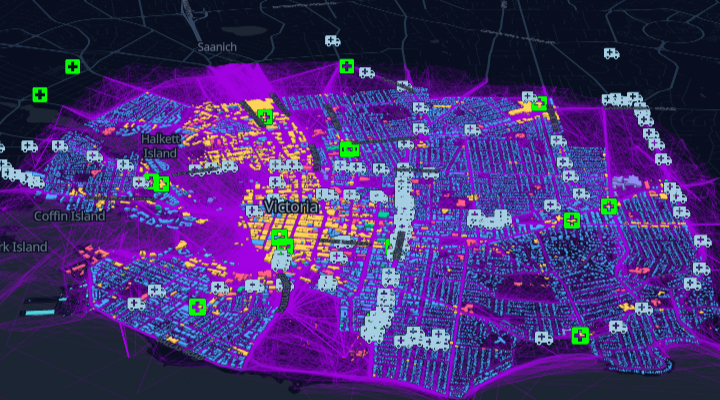
Victoria’s Human Mobility

The interactive map displays human mobility patterns during the pandemic in Victoria, British Columbia (Canada).
Ethanol Tanks Visualization

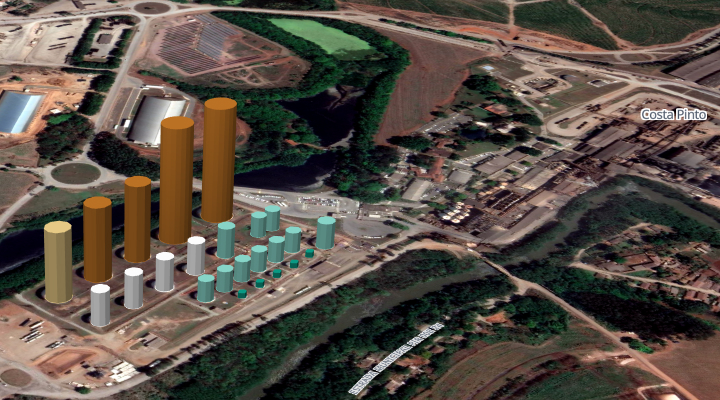
Ethanol Tanks Visualization

At the first zoom level, map shows the mills of ethanol storage, statistics on the number, and total volume of storage for each mill
E-Waste

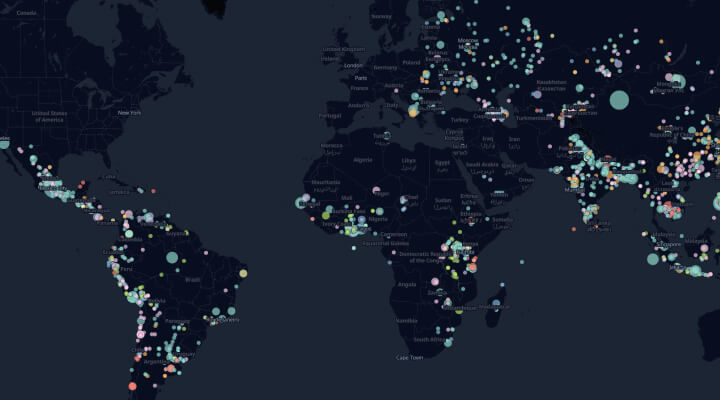
E-Waste

E-waste impact map. Color stylization by type of waste origin, and size differentiation by the number of people at risk.
Home Chemicals
Business Solution
Industries
Public SafetyPublic Safety and COVID-19 RetailHealthcare RetailRetail EnvironmentSmart City Financial ServicesFinancial Services Transport & LogisticsTransport & Logistics GovernmentGovernment Real EstateReal Estate EnvironmentEnvironment
Product Overview
Features Map Gallery Aspectum for Business Platform Security Aspectum vs Competitors User Guide API
Services
Data on Demand Custom Development Expert Sessions Technical Support
Pricing
Blog
About Us
Log out
Sign in Sign up
Industries
Public Safety and COVID-19 Healthcare Retail Smart City Financial Services Transport & Logistics Government Real Estate Environment
Product Overview
Features Map Gallery Aspectum for Business Platform Security Pricing Aspectum vs Competitors User Guide API
Services
Data on Demand Custom Development Resellers Program Expert Sessions Technical Support
Blog
About Us
GIS Usage
Spatial Analysis Geocoding WebGIS GIS data What is GIS Location
Intelligence
Facebook Twitter GitHub LinkedIn YouTube
Privacy Policy Terms of Use
© Copyright 2021 Earth Observing System. All rights reserved.
This website uses cookies and also collects some information using analytics software to improve user experience.
By continuing to browse this website you accept the use of cookies. See Privacy Policy to know more about how we use cookies.