This website uses cookies and also collects some information using analytics software to improve user experience.
By continuing to browse this website you accept the use of cookies. See Privacy Policy to know more about how we use cookies.
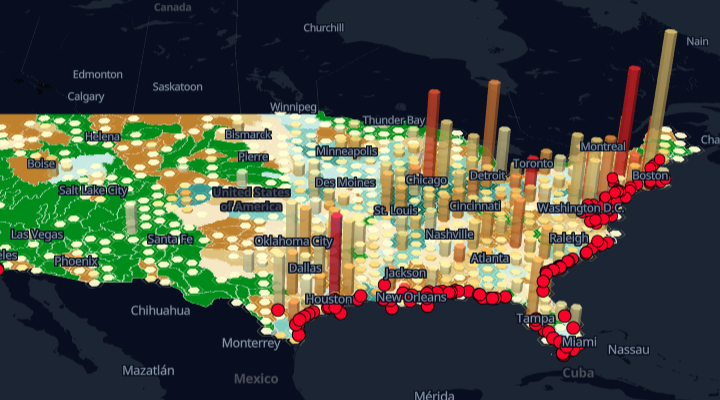
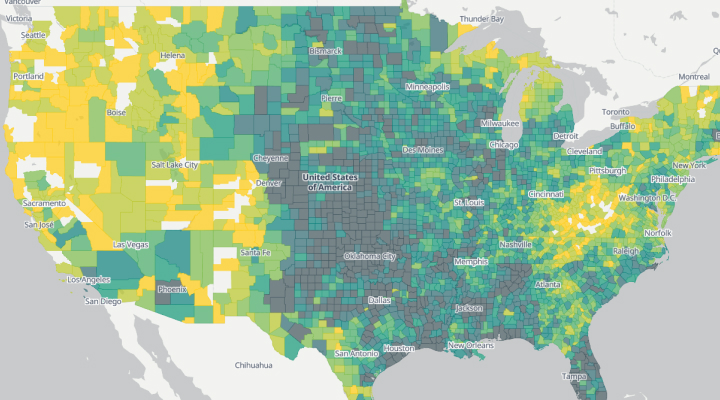
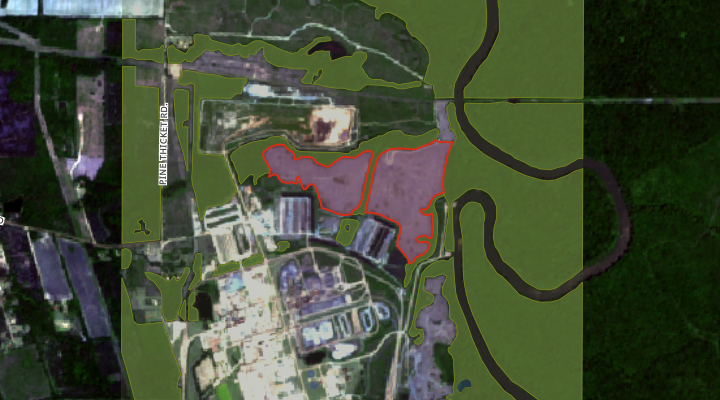
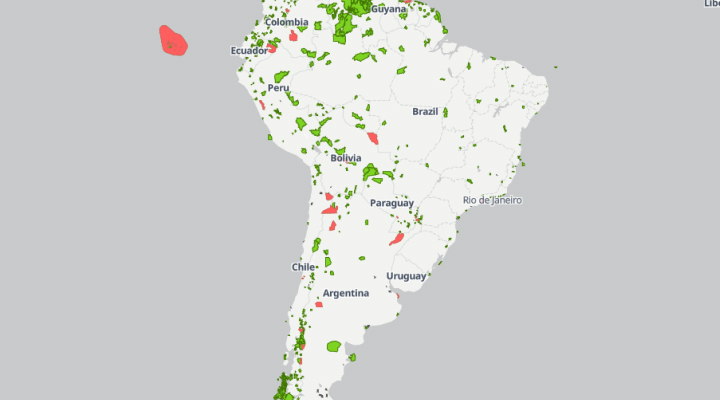
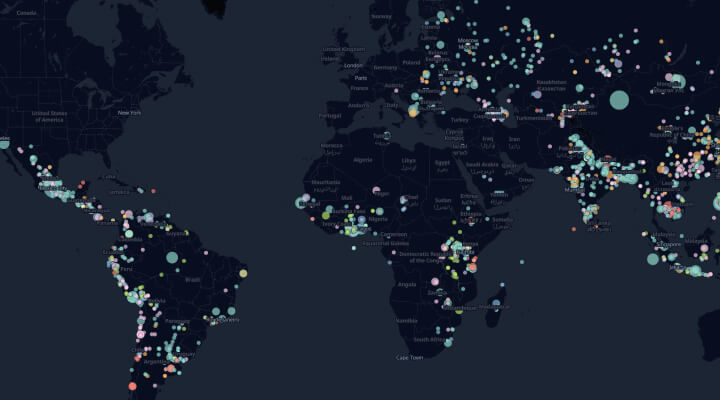
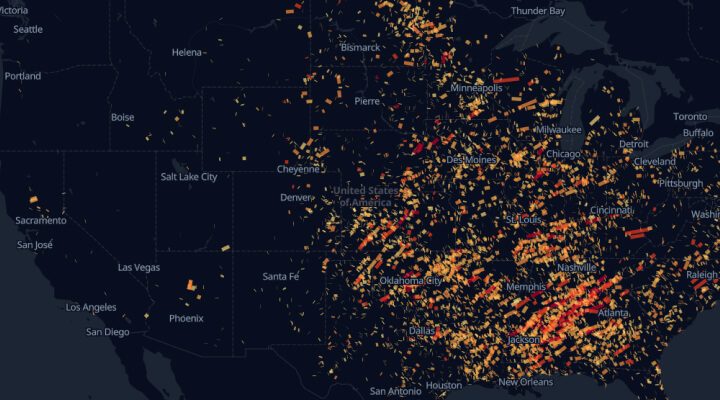
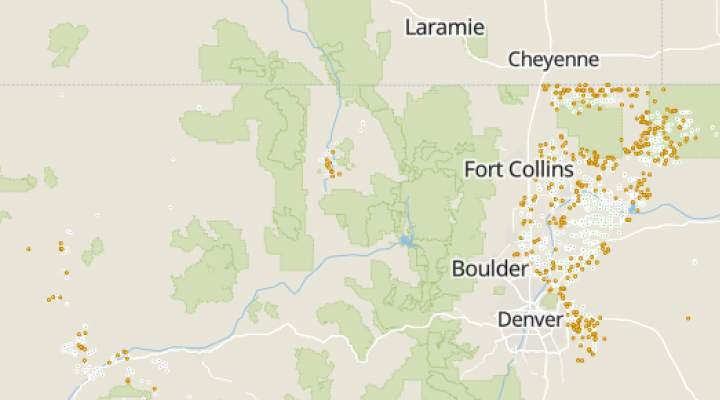
Industrial water pollution in US
The map shows classify areas according to the number of industrial facilities and how much wastewater they generate